AI Tool for data visualization.
Transform your data into stunning, interactive visualizations with AI-powered chart recommendations and custom styling
What you can do with Data Visualizer
AI-Powered Chart Recommendations
Upload your data and let AI analyze the best visualization types. Get intelligent suggestions for bar charts, line graphs, pie charts, and more based on your data structure.
📊 "Your sales data is perfect for a time series chart"
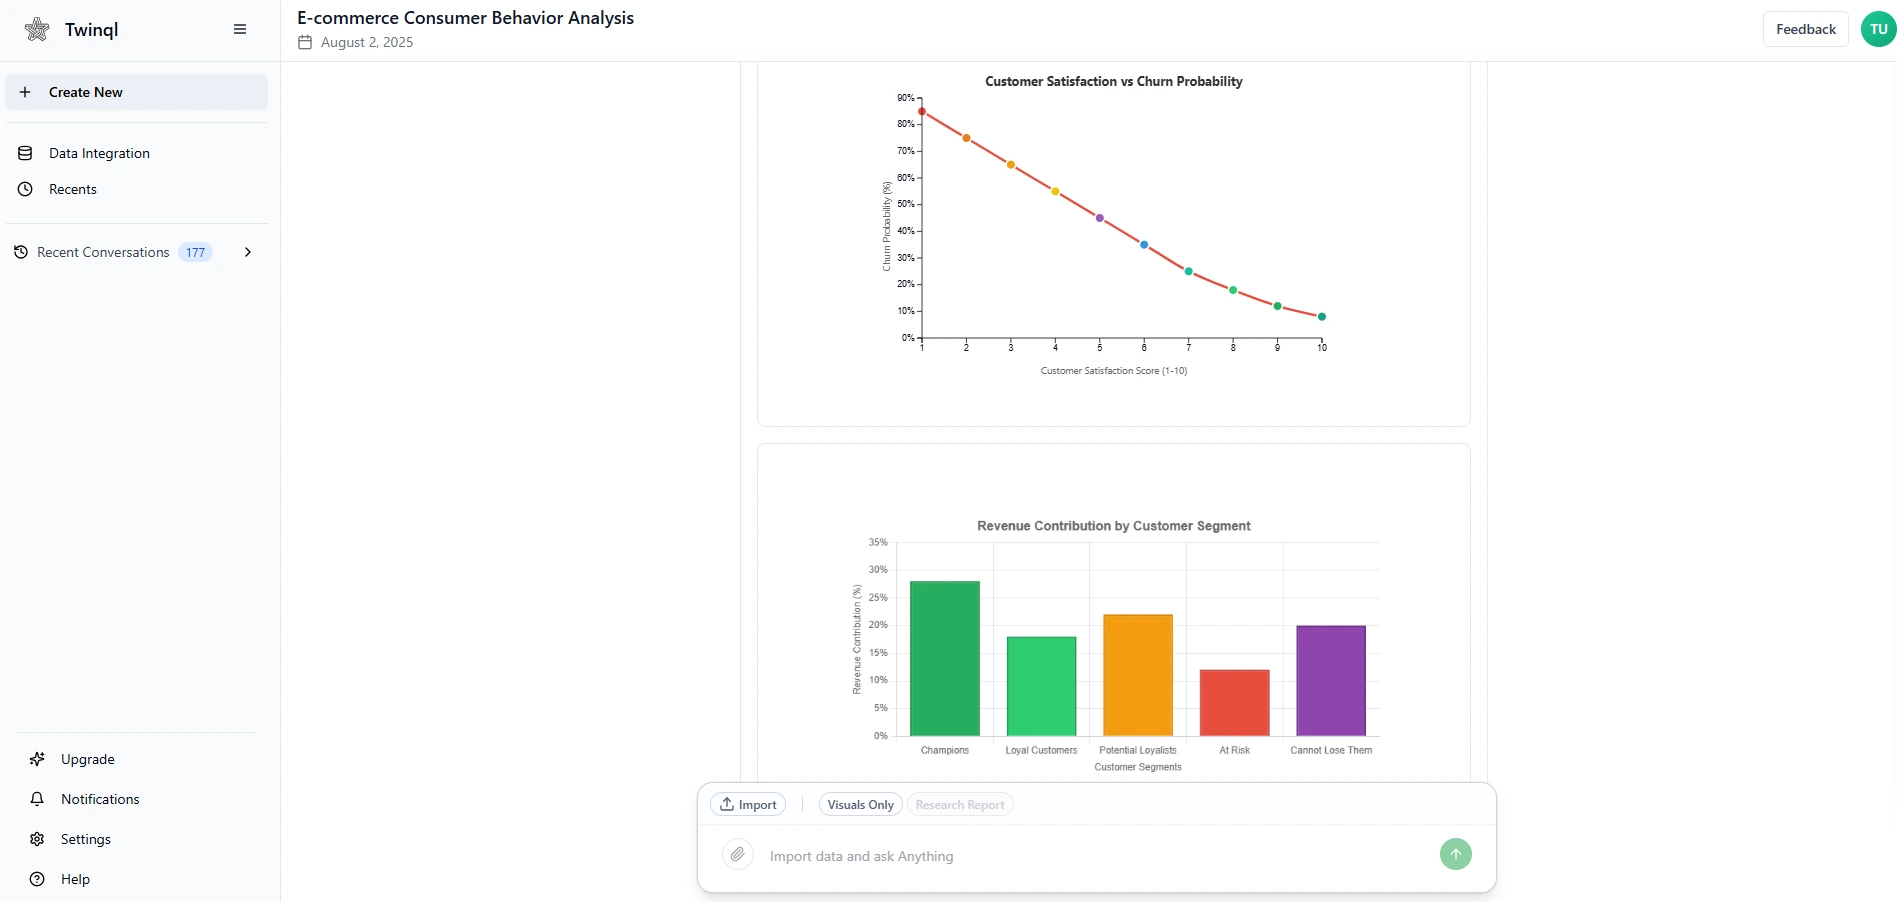
Complex Visuals on Demand
Generate intricate visualizations instantly. Customize and adapt visuals to meet specific data needs, ensuring clarity and precision in data representation.
Custom Brand Color - Hex codes
Customize every aspect of your visualizations. Choose from beautiful color palettes, fonts, and themes to match your brand identity perfectly.
Explore Other Products
Discover our complete suite of data tools designed to streamline your workflow
AI Data Analyst
Conversational AI that transforms your data into actionable insights through natural language queries and intelligent analysis.
Data Integration
Connect and sync data from multiple sources with our powerful integration platform. Real-time synchronization across all your data systems.
Data Tokenizer
Secure data processing with advanced tokenization for privacy-preserving analytics. Maximum security without compromising performance.
Start Free with Twinql
Join thousands of businesses transforming their data analysis workflow.
No credit card required • 100% secure